Buckets
You can group multiple data points into a single item, called a bucket, to simplify analysis.
Note: Bucketing is not available for all chart data types.
Create a Bucket
To create a bucket:
-
Go to the Chart Builder or Dataset > Analyze and select the bucket icon in the upper-right toolbar.

-
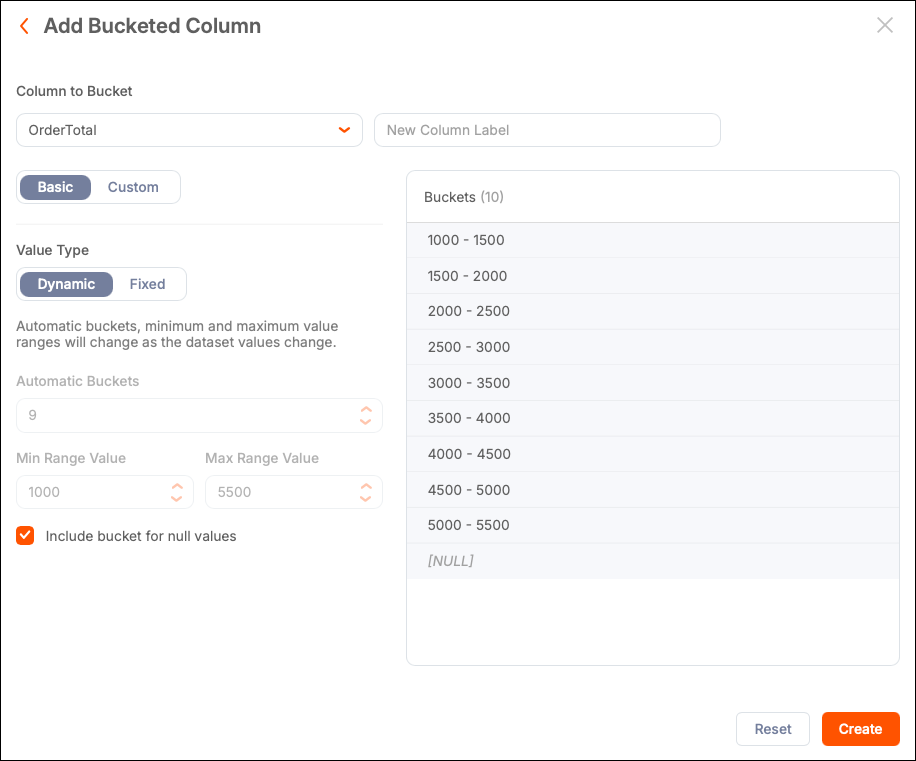
Select Add Bucketed Column.
-
In the bucket editor:
- Select a column to group into buckets.
- Enter a label for your new bucketed column.
-
Add configuration values for the column's data type.
-
Select Create.
The new bucketed column is available for analysis throughout the application.
Manage Buckets
The Buckets modal displays bucketed columns that contain icons to duplicate, edit, and delete the bucket.
Numeric Columns
For numeric columns, select one of the following options:
-
Basic: Automatically manage buckets.
- Dynamic: Buckets adjust as data changes.
- Fixed: Specify the number of buckets, minimum, and maximum range values.
-
Custom: Manually create, label, adjust, add, or remove buckets.
Text Columns
For text columns:
- Enter a comma-separated list of bucket names (for example, Lite, Pro) and select Add Bucket.
- Select a bucket from the list, then select one or more items from the values list to assign values to the bucket.
Date Columns
For date columns:
-
Select + Add Custom Bucket.
-
Label the bucket and set conditions to group data points.
To delete a bucket, select Remove. To reorder buckets, select the drag handles.
For example, you can create buckets for specific date ranges, such as 2014, 2015–2019, and 2020–2025. Data points outside these ranges are omitted unless you create a catch-all bucket.
Null Values
When a Qrvey admin sets the default to Include in the Admin Center, NULL values can be placed in their own bucket.