Sorting
You can sort data in several ways within the Chart Builder. By default, most charts sort data by the grouped column in ascending order.

Details
- XY Charts (Bar, Line, Symbol, Multiseries, and so on) that use one grouped Category and one aggregated Values column can be sorted by either the Category or the Values, but not both simultaneously.
- Multiseries Charts can also be sorted by either the Category or Values column, while the Series column can be sorted independently at the same time.
- Tables can be sorted by one or more columns. Sorting by multiple columns allows you to first sort by one column, followed by the sorting logic of the next column (for example, sorting by Country and then City). You can also sort by columns that are not visible in the table (listed in the Other Columns section).

- Crosstab Charts can be sorted by parent and child columns.

Charts
The configuration panel displays a Sorting section for most chart types. This section includes a dropdown list of all columns in the dataset, with the selected option representing the column (or aggregated column) used for sorting.
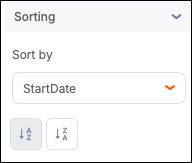
Use this dropdown to select a column to sort by. Charts can also be sorted by columns not included in the chart. Columns included in the chart are listed separately, along with their role in the visualization.
For charts created from Live Connect datasets, sorting supports min/max aggregations for text columns. However, min/max text aggregations are not supported for sorting in charts created from managed datasets.
Self-Service Sorting Option
Sorting can be enabled as a self-service option in the chart configuration panel. Most chart types support self-service sorting. You can enable it in the General panel under Self-Service Options.
Column Pill
Select the options (three-dot) menu in a field's pillbox. By default, column pills display their sorting direction using an arrow. Columns used in tables and crosstabs also support removing sorting to produce an unsorted dataset. The Clear Sorting option is accessible from the same menu in the column pill of these charts.
