Customize Chart Styles
Style themes provide consistent look and feel across Qrvey dashboards. As a data analyst, you can create custom themes and adjust visual elements. As a software engineer, you can add themes to embedded applications.
Overview
You can quickly create a consistent theme in Qrvey to obtain control over fonts, panel backgrounds, tables, color palettes, and visibility. Set the theme ID (themeid property) in your widget to deliver consistent embedded experiences, and share themes across applications to keep your instance on brand.
Chart Style Customization Tutorial
The following tutorial video shows how to use themes to customize the appearance of charts and metrics,
Tags: Charts, Customizations, Themes
Create a New Theme
-
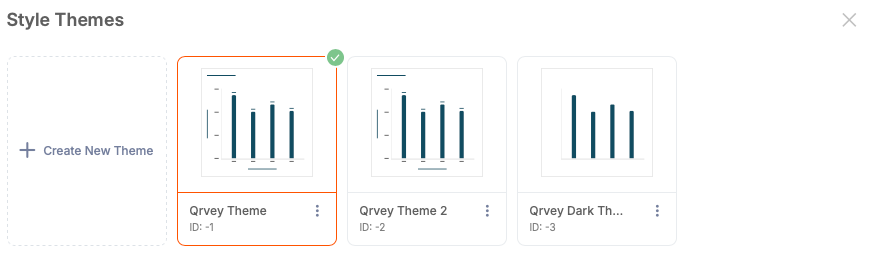
Open the Dashboard Builder and select Style Themes from the toolbar.

If a legacy dashboard is published, Style Themes is disabled in the Dashboard Builder. Select Edit Dashboard to enable the feature.
When the dashboard is in edit mode, you can open the Style Themes modal and view themes that already exist or create new ones.
-
Select Create New Theme.
-
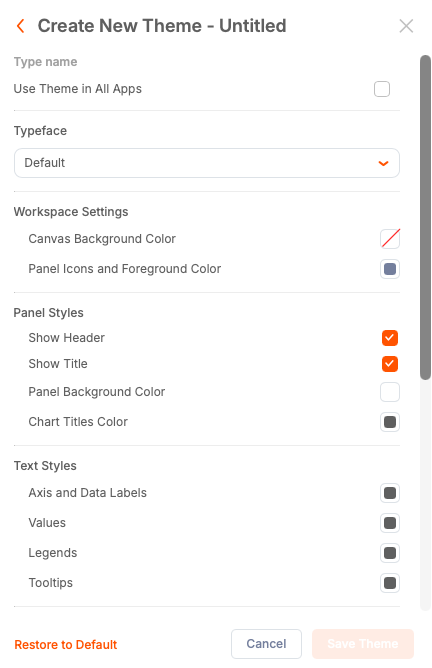
Enter a name for your theme. You cannot save the theme without a name.
-
Change theme settings for branding and accessibility.
- Typeface - Controls fonts for chart titles, axes, legends, and data labels.
- Canvas Background Color - The dashboard background color.
- Panel Background Color - Background for each chart panel. To emulate dark mode, set a dark gray or near-black background.
Design a Dark Mode theme
After setting a dark panel background, text and icons can be hard to read. To make fonts and panel icons contrast with the panel background, change them to white or a light color.
-
Edit the theme and adjust the following areas to a light color:
- Text styles: Axis and Data Labels, Values, Legends, Tooltips
- Chart title color
Check table styles. Many tables use alternating row styles which take precedence over theme settings. To change the header to dark mode, edit the table header style to set the header background tp dark and header font color to light.
-
Select Save Theme to Save your changes.
-
Preview your dashboard and make further adjustments if any element does not contrast properly with the new background.
Color Palette and Series Colors
By default, single-series charts render in Qrvey's default blue color. You can change the default single-series color by changing the Main Color under Data Styles, or you can generate a new color palette.
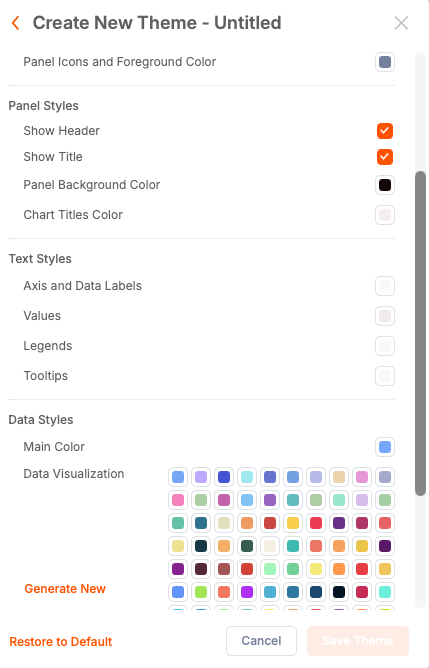
The palette defines the order of colors used for multi-series charts. You can also edit individual colors to better match your dark mode and maintain contrast.
Controlling Titles and Headers
The theme editor contains the following visibility toggles:
- Uncheck Show Title to remove chart titles across the dashboard.
- Uncheck Show Header to remove the entire panel header and chart controls. This hides both the title and any interactive controls so users cannot interact with the chart.
These options are useful when embedding dashboards where interaction is not required.
Managing Themes
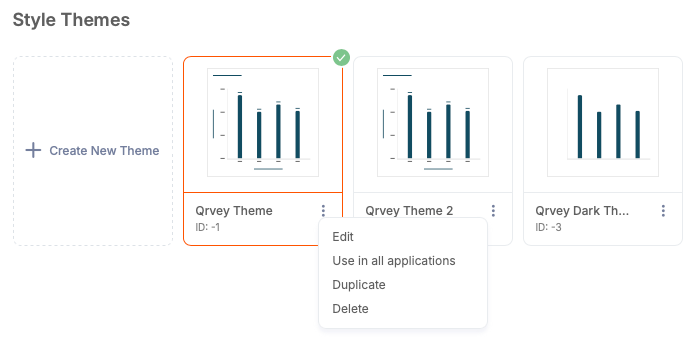
The owner of the application that contains dashboards can edit, duplicate, or delete themes. If you are the owner of a dashboard but not the application, the edit, duplicate, and delete controls will not be available.
To make a theme available for all applications in your Qrvey instance, enable Use in all applications or check the corresponding box while editing the theme. When enabled, the theme applies to all applications in your Qrvey instance.
Use Theme ID for Embedded Dashboards
Each theme displays a theme ID below its title. This ID can be copied to the clipboard and used when embedding the dashboard widget. The widget configuration property is called themeid. By passing the ID into the widget configuration, you can toggle themes dynamically for embedded dashboards. The themeid can only be passed in the configuration object of the widget and is not supported in the JWT token passed in the qvToken.
var config = {
  domain: "https://<YOUR_QRVEY_DOMAIN>",
  dashboardId: "<DASHBOARD_ID>",
  themeId: "-3",
  qvToken: "<qv_token>"
};
Best Practices
- Modify existing or create a new theme that matches your brand colors.
- Create a new color palette for multi-series charts.
- Enable or disable titles and headers in charts.
- Either use the theme only in the current application, or in all applications.
- Pass the theme ID to the dashboard widget and toggle themes dynamically.