Data Cleansing Using Transformations
Well-designed dataset transformations prevent fragmented insights and keep the data clean in your dashboards. By applying the following techniques, you can ensure that your charts reflect reality, not accidental string differences.
Overview
Inconsistent data can produce negative outcomes for your dashboard output. Small differences — a white space, mixed case, or an unexpected newline — can turn identical values into separate buckets. By using Qrvey dataset transformations, you can perform targeted data scrubbing that normalizes fields before analysis.
Impact of Data Scrubbing
The analytics engine interprets values literally. A string containing a single character difference, including whitespace, is treated as a distinct value. That inflates counts, fragments groups, and breaks visualizations. Common issues include:
- Case differences — uppercase, lowercase, and camelcase variants.
- Leading or trailing whitespace — invisible but significant.
- Hidden characters — carriage returns or newlines embedded in a string.
Housekeeping Tasks
- Trim unwanted characters (usually whitespace) from relevant columns.
- Standardize case (for example, convert to uppercase).
- Apply targeted replacements for messy or inconsistent values using a custom formula.
- Reload the dataset when transformations must apply to existing records.
Data Cleansing Tutorial
The following tutorial video shows how to use transformations to clean a country column for a sample dataset.
Tags: Data, Dataset
Normalize the Country Field
Step 1: Inspect the problem
Review the visualization or raw data to see how country values are displayed. You might see separate buckets for "united states", "United States", "United States of America", and entries with trailing spaces or newline characters. This fragmentation needs to be eliminated.
Step 2: Open Dataset Transformations
From the dataset design page, select Transformations. This area contains functions for text manipulation, numeric operations, date calculations, JSON flattening, and a custom formula option using JavaScript syntax.
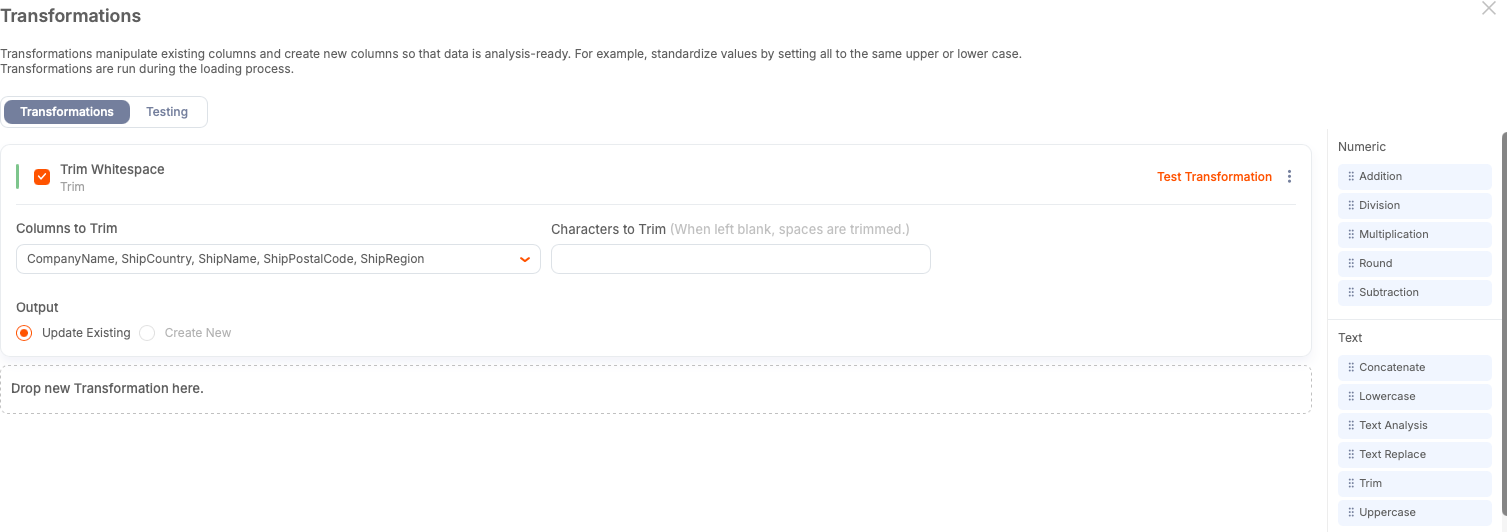
Step 3: Remove Excess Whitespace from Fields
Use the Trim transform first. You can select multiple columns at once — trimming is harmless on most text fields and saves time.
-
Leave the trim value blank to remove standard whitespace.
-
Select Update Existing unless you want the original column preserved.
-
Give the transformation a descriptive internal name.
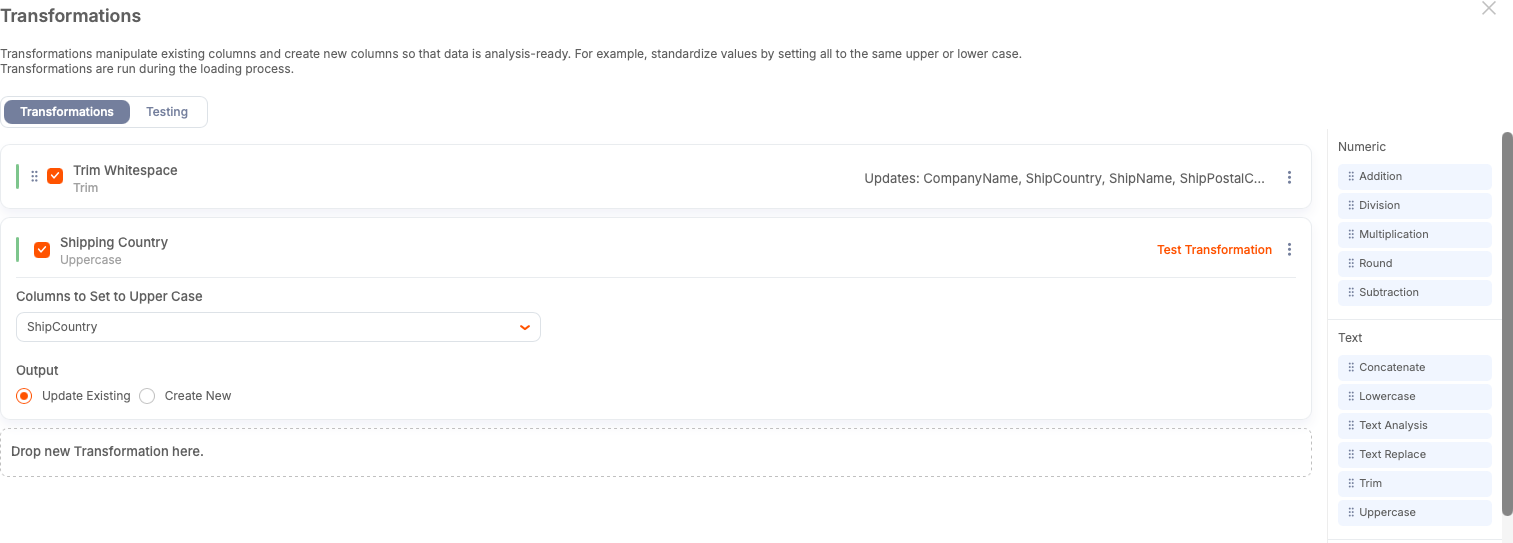
Step 4: Standardize Case
To avoid case-based fragmentation, convert the country values to a consistent case.
For example, the use of uppercase characters for country codes and names can remove ambiguity. To apply this syntax:
-
Select the country column.
-
Select the uppercase transform.
-
Select Update Existing.
Step 5: Apply Transforms to Existing Records
Transforms apply only to new or updated records if you don't reload the dataset. If you want the changes reflected across existing data, perform a full reload after creating your transforms.
Step 6: Handle Stubborn Cases with a Custom Formula
Trimming and case normalization won't catch embedded control characters or long variations such as "United States of America." To address these variations, you can write a small conditional formula to standardize known patterns. The following example uses JavaScript syntax to check the country string for the keyword America.
if (country.includes("America")) {
   return "USA";
} else {
   return country;
}
If the string matches, the script replaces all strings that include America with USA.
Step 7: Update the Field and Reload
Set the custom formula to update the existing country column. Apply your changes and perform a reload if you need the transformations to take effect on historical rows. After the reload completes, verify that the chart or dataset groups countries correctly.
Checklist
- Trim text fields that might contain accidental whitespace.
- Standardize case across categorical fields.
- Use targeted replacements for known variations and messy entries.
- Reload your dataset to apply transformations to the entire datasets. Otherwise, they will only apply to new records.
- Decide whether transforms should apply retroactively (full reload) or only to new data (no reload).
- Keep transform names descriptive for maintainability.
Best Practices
- Transformations make your datasets reliable.
- Create new transformation columns to preserve your data.
- Update the existing column with transformed values to save space.
- Maintain a short library of common formulas for country names, product SKUs, and other frequently messy fields.